Abstract
USING A STATISTICAL
MODEL TO PREDICT
SOCCER MATCHES

Investigating statistical models by attempting to predict soccer results using Poisson distribution and Maximum likelihood-based parameter estimation .
Introduction
Most sports are often considered immensely unpredictable, and soccer is no exception. Yet, it is common to see predictions of matches, whether it’s from an expert or between a few fans. Experts tend to use their vast knowledge and intuition of the sport to generate their predictions. Yet, the various data and figures available about a team or league beg the question “Can statistics and probabilities be used to predict the outcome of individual matches or entire seasons?” Most soccer fans, myself included, have a distinct appreciation for the ‘randomness’ within the sport and this investigation seeks to find a model that predicts results of soccer matches. This exploration investigates predicting soccer results using a potential mathematical model. Using the data for Chelsea FC from the 2013-14 Barclays Premier League (BPL) season, the predicted results are then compared to the actual 2014-15 Barclays Premier League season.
Rationale
This exploration is being done to find an accurate model for predicting soccer match results. This model would be very useful to soccer experts or soccer fans like myself. The analysis will take into account a number of factors, including each team’s offensive and defensive ability. One main model being used during the simulations is called ‘Maximum likelihood-based parameter estimation’. Undoubtedly the predictions made will not be completely accurate, however it may provide a good understanding of what is most likely to occur. Every possible factor affecting a soccer game cannot be taken into account, which serves as the first limitation with the model being used for this exploration
Method
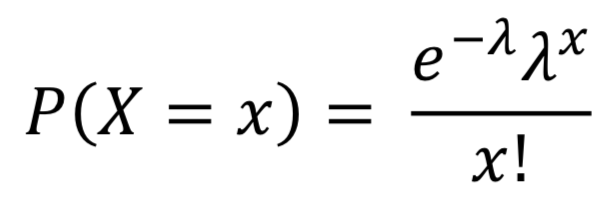
This investigation used Poisson distribution to find the expected results for each individual match. Poisson distribution is based on a sole parameter 𝜆 where:
- 𝜆 is the average number of events in an interval, which is the event rate (or rate parameter)
- 𝑥 is the number of ‘events’ that take place during the time period. 𝑥 must be a positive integer
The probability that a Poisson random variable equals 𝑥 is:

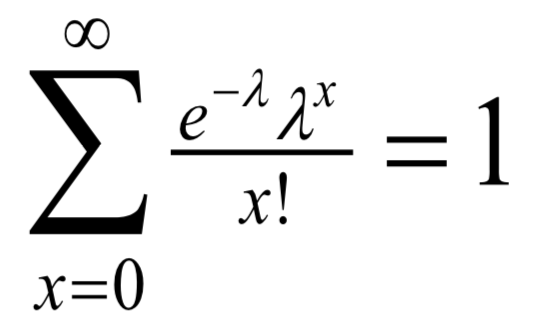
As it is used to calculate the probability of how many times the event will occur, and since the total probability of the number of events to occur is 1:

The count can then be modeled using Maximum likelihood-based parameter estimation. It uses additional variables which describe the number of number of events over the time period where:
- 𝝁 = 𝜃𝒚 in which:
- 𝒚 is the input vector which consists of the independent predictor (parameter) variables
- 𝜃 is based on the fit which is estimated by maximum likelihood
The mean of the predicted Poisson distribution is written as:

This model is then applied to the data which is Chelsea FC’s match results from the 2013-14 Barclays Premier League season.
Results
Using Poisson distribution, the probability of each outcome for the number of goals that Chelsea FC scores or concedes against every other team is calculated, from 0 goals to 5 goals. This was then displayed on a table which shows the probabilities for a single game:

The highlighted box showed the most probable outcome for that game. This was repeated for each game that Chelsea FC plays in a season. The results from these tables was then used to find the number of points Chelsea FC are predicted to get along with predicted goals scored and goals conceded. This was then compared to the actual 2014-15 Barclays Premier League season for Chelsea FC.
Using the data from the tables, the predicated table for Chelsea FC was made:

Which can be compared to the actual 2014-15 Barclays Premier League season:

Finally, a table comparing the above two tables was created:

Conclusion
As seen in the data, the number of points Chelsea FC are predicted to attain and the number of points they actually obtained were the same (87 points). This shows that the model used was accurate for its primary task – to predict the outcome of Chelsea’s overall 2014-15 Barclays Premier League season. The number of Home Losses (0) and Away Losses (3) were also the same, while most other aspects were close. This shows that the probability model used in this exploration has been successful, to a certain extent, in predicting the results for Chelsea FC. The reason for the relative accuracy of the model could be attributed to the usage of the parameters used in Maximum likelihood-based parameter estimation, however, using more parameters could have provided more accurate results.
This model only uses 2 parameters, however, there are far more factors which affect a single soccer match. Most of those cannot be easily quantified. Hence, this cannot be included in the model, which adds to the inaccuracies within this model, Also, this exploration only used one set of data as input for creating the model. This single data set was used to calculate both parameters used which were in turn used to predict the 2014-15 Barclays Premier League season results for Chelsea FC. The random errors can be reduced by including more sets of data (ie. More Barclays Premier League seasons)
Despite the inaccuracies. this model could potentially be used to predict the outcomes of soccer matches or those of other sports as well. Additional parameters and increased data sets would help the accuracy and minimize error. To further investigate, more seasons can be taken into account to reduce random error and increase the precision of the model.